Analisi Economica
Introduction
The Analysis and Reporting section allows you to generate quantitative and statistical reports to monitor volumes, values, and performance of logistics activities.
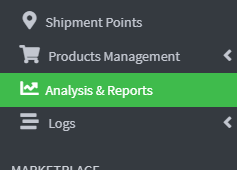
To access, click on Analysis and Reports in the left menu under Operations.
Economic Analysis
1. Reports focused on the economic aspects of logistics, with the aim of monitoring shipping costs and assessing their margins.
It allows you to analyze shipping costs based on:
- Reference period (days, weeks, months, etc.)
- Shipping service (courier, type, etc.)
Reports dedicated to monitoring daily operational activities, with a focus on identifying critical issues and anomalies.
Identify orders that exhibit operational anomalies, such as:
- Late orders
- Unfulfilled orders
It displays the total quantity of shipments broken down by tracking status (e.g., in transit, delivered, in storage, etc.) and provides an aggregated view that allows you to understand the overall status of your shipments in real time.
Reports focused on the economic aspects of logistics, to monitor costs, efficiency, and margins.
Shipping cost analysis based on:
- Reference period (days, weeks, months, etc.)
- Shipping service (courier or shipping type)
2. Click the Query button to access the Report Generation page. 
3. On this page you can generate statistical reports on the products managed over time , with the possibility of applying various dynamic filters.
4. The Team field is used to filter data based on the workgroup that managed the shipments. This is useful if your company has multiple departments or teams handling different shipments.
Example: you can see the costs generated only by Team Italy, or only by Team Europe.

5. Date Range lets you choose the time period to analyze, so you can focus on a month, a week, or even just a single day.

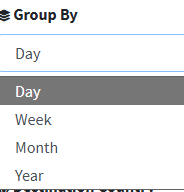
6. In the Group by drop-down menu , we can choose to show data by:
- Day: Useful if you want a very detailed analysis, to understand which days had the highest costs or the most shipments.
- Example: See if costs are higher on Mondays than the rest of the week.
- Week: This helps you get a clearer view without too much detail, but is still useful for monitoring progress.
- Example: Compare the first week of the month with the second to see if volumes are growing.
- Month: Perfect for medium-term analysis and comparisons between different months.
- Example: Check whether shipping costs were higher in August than in September.
- Year: Useful for long-term statistics and to see the overall trend.
- Example: Compare shipping costs in 2024 with those in 2025.
7. In the Courier field, you can select one or more couriers used for shipments. This helps you compare costs between various operators (e.g., DHL, UPS, GLS).
Example: You can see how much you spent with DHL versus UPS over the same period.

8. Courier Service : Select the type of service you'd like to receive with the courier. Couriers offer several options: standard, express, and economy.
Example: You can find out if express service is significantly more expensive than standard.

9. Warehouse filters data based on the warehouse from which the shipment originated. Useful if you have multiple locations or warehouses.
Example: Compare shipping costs from the Milan warehouse with those from the Rome warehouse.

10. The Destination Country drop-down menu only shows shipments sent to a specific country. This helps you understand costs by country and compare different markets.
Example: See if shipping to Germany costs more or less than to France.

11. In the Sales Channel drop-down menu, you can select the channel through which the order was placed. Each channel may have different costs: e-commerce, physical store, marketplace (e.g., Amazon).
Example: Analyze shipping costs only for orders arriving from Amazon.

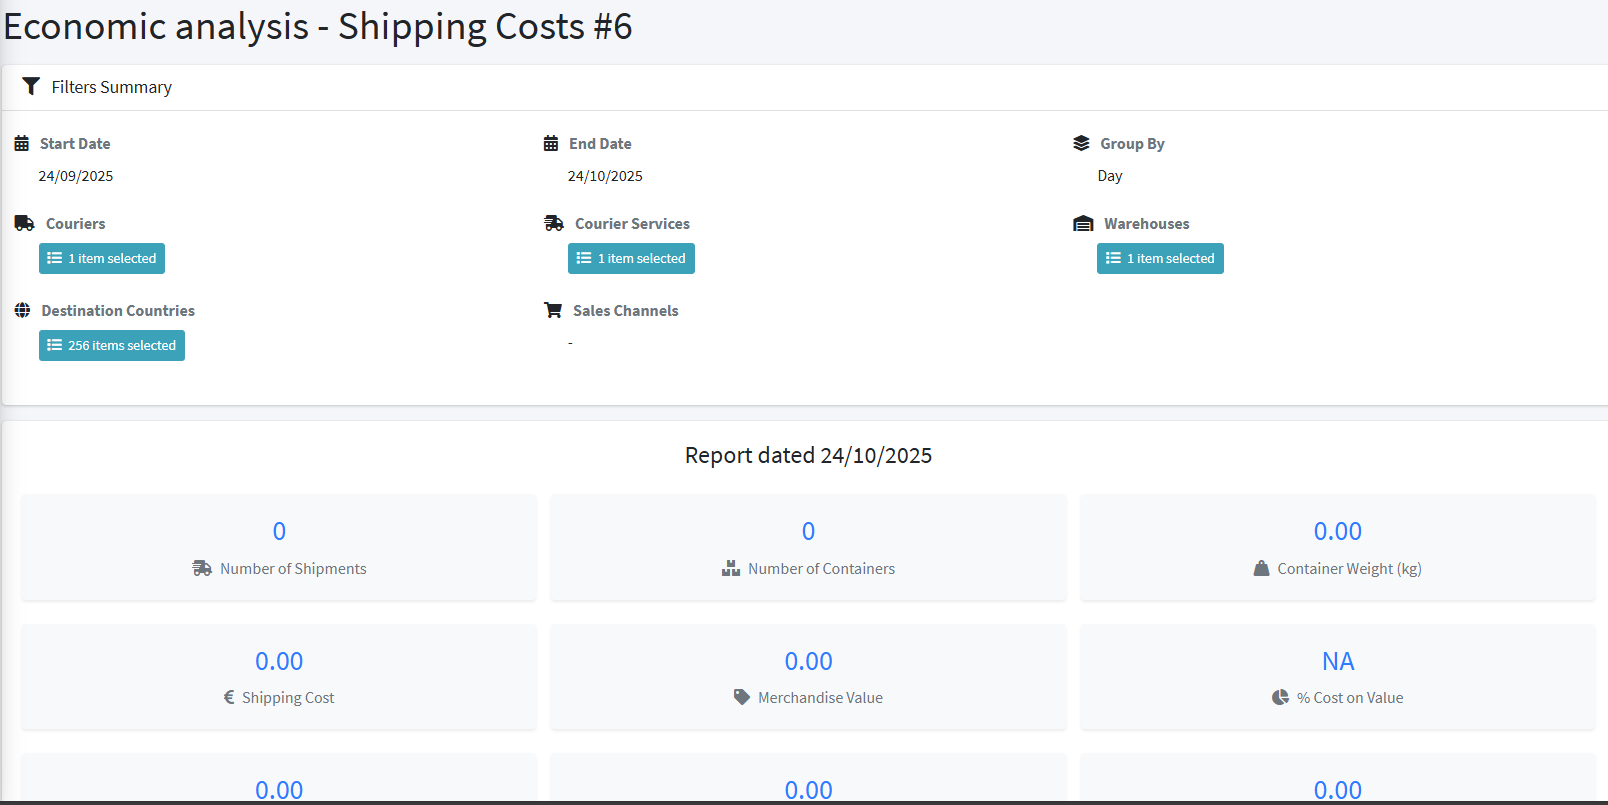
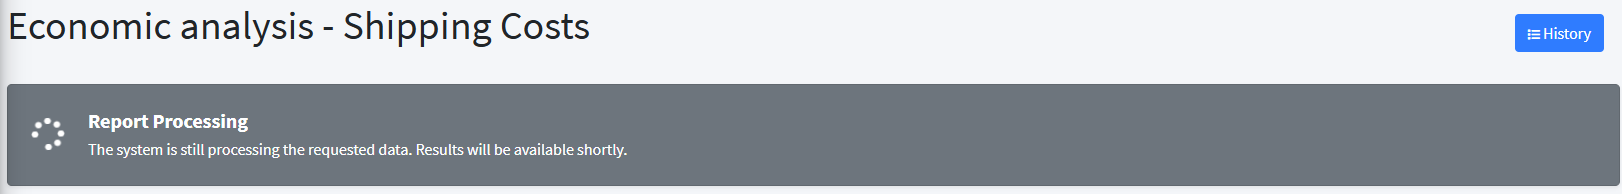
12. 11. Click the Generate Report button to start processing the requested data. 
13. Once the Report has been generated, it can be viewed on the main page by clicking on the View Full Report button